the Electoral College
for 25 Years!
1999 - 2024
election year or...
Ads are placed by Google. No endorsement by President Elect should be inferred.
2020: ELECTORAL COLLEGE MAP | MAKE YOUR OWN MAP
  | Joe Biden Kamala Harris Party: DEMOCRATIC Electoral Votes: 306 | ||||||||||||
  | Donald Trump Mike Pence Party: REPUBLICAN Electoral Votes: 232 | ||||||||||||
  | Jo Jorgensen Spike Cohen Party: LIBERTARIAN Electoral Votes: 0 | ||||||||||||
Other Candidates
Green, Others...
Electoral Votes:
0 |
|||||||||||||
Electoral College Vote Total electoral votes (from 50 states & DC) - 538 Majority needed to win - 270
Popular Vote
|
|||||||||||||

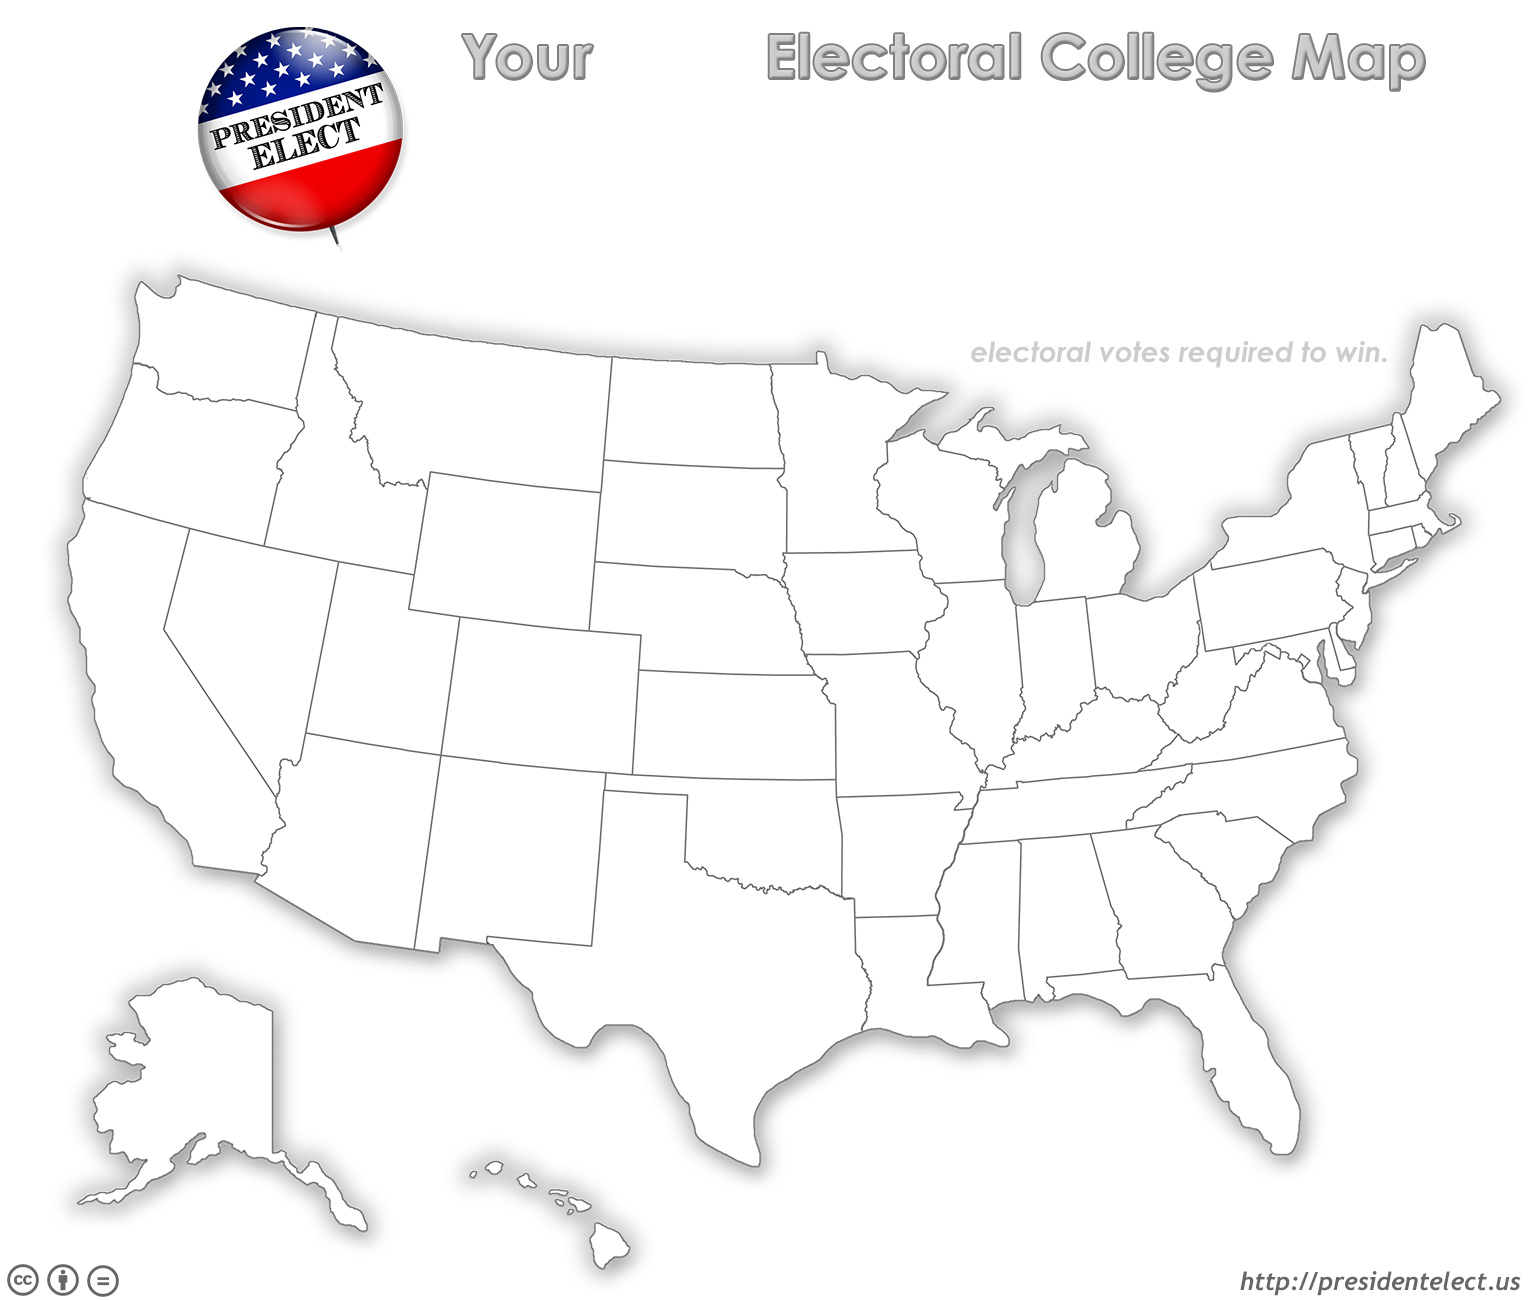

| Alabama – | Alaska – | Arizona – | Arkansas – | California – |
| Colorado – | Connecticut – | Delaware – | DC – | Florida – |
| Georgia – | Hawaii – | Idaho – | Illinois – | Indiana – |
| Iowa – | Kansas – | Kentucky – | Louisiana – | Maine – |
| Maryland – | Massachusetts – | Michigan – | Minnesota – | Mississippi – |
| Missouri – | Montana – | Nebraska – | Nevada – | New Hampshire – |
| New Jersey – | New Mexico – | New York – | North Carolina – | North Dakota – |
| Ohio – | Oklahoma – | Oregon – | Pennsylvania – | Rhode Island – |
| South Carolina – | South Dakota – | Tennessee – | Texas – | Utah – |
| Vermont – | Virginia – | Washington – | West Virginia – | Wisconsin – |
| Wyoming – | Randomize Map | Map | Clear Map | |
If the historical map for this year had a split state vote, the electoral total when clicking " Map" will not be correct.
| STATE | ELECTORAL VOTES |
BIDEN | TRUMP | JORGENSEN | OTHERS | |
| ALABAMA | 9 | 849,624 36.6% | 1,441,170 62.0% | 25,176 1.1% | 7,312 0.3% | |
| AL ELECTORS | Dennis H. Beavers, Jeana S. Boggs, Joseph R. Fuller, Jacquelyn Gay, John H. Killian, Rick Pate, J. Elbert Peters, Joan Reynolds, John Wahl | |||||
| ALASKA | 3 | 153,778 42.8% | 189,951 52.8% | 8,897 2.5% | 6,904 1.9% | |
| AK ELECTORS | John Binkley, Judy Eledge, Randy Ruedrich | |||||
| ARIZONA | 11 | 1,672,143 49.4% | 1,661,686 49.1% | 51,465 1.5% | 2,032 0.1% | |
| AZ ELECTORS | Steve Gallardo, Luis Alberto Heredia, Constance Jackson, Sandra D. Kennedy, Stephen Roe Lewis, James McLaughlin, Jonathan Nez, Ned Norris, Regina Romero, Felecia Rotellini, Fred Yamashita | |||||
| ARKANSAS | 6 | 423,932 34.8% | 760,647 62.4% | 13,133 1.1% | 21,357 1.8% | |
| AR ELECTORS | Sharon Brooks, Iverson Jackson, George Ritter, Rod Soubers, Doyle Webb, Joseph Wood | |||||
| CALIFORNIA | 55 | 11,110,639 63.5% | 6,006,518 34.3% | 187,910 1.1% | 196,313 1.1% | |
| CA ELECTORS | Agustin Arreola, Joy Atkinson, Katherine Bancroft, Kara Bechtle, Brandon Benjamin, Janine Bera, Peter Bolland, Mary Bowker, Janice Brown, Patty Cappelluti, John Casey, Jacki Cisneros, Marsha Conant, Joseph Patrick Cox, Freddye Davis, Emily Dredd, Lee Fink, Bryan Fletcher, Mark Gonzalez, Madeline Handy, Ronald Herrera, Rusty Kicks, Jihee Huh, LaNiece Jones, Elizabeth Kann, David Kennedy, Dona Kerkvliet-Varin, Vinzenz Koller, Franklin Lima, Christina Marquez, Yvette Martinez, Paul "Pete" McCloskey, Thomas McInerney, Jillian McNerney, Nelida Mendoza, Betty Monroy, Brock Neeley, Jane Pandell, Wiliam Prady, Andre Quintero, Amy Rao, Kevin Sabellico, Anne Sanger, Mattie Scott, Suzanne Singer, Brian Solecki, Darrell Steinberg, Erin Sturdivant, Naomi Tomita, Robert Torres, Karen Waters, Shirley Weber, Katherine Wilkinson, Tayte Williams, Brandon Zavala | |||||
| COLORADO | 9 | 1,804,352 55.4% | 1,364,607 41.9% | 52,460 1.6% | 35,561 1.1% | |
| CO ELECTORS | Polly B. Baca, Roger Fang, Bryan Hartmann, Judith Ingelido, Alan Hamilton Kennedy, Anita Lynch, Victoria E. Marquesen, Susan McFaddin, Jerad V. Sutton | |||||
| CONNECTICUT | 7 | 1,080,831 59.3% | 714,717 39.2% | 20,230 1.1% | 8,079 0.4% | |
| CT ELECTORS | Susan Barrett, John Kalamarides, Dana Barcellos-Allen, William Smith, Myrna Watanabe, Anthony Attanasio, Dominic F. Balletto& Jr. | |||||
| DELAWARE | 3 | 296,268 58.7% | 200,603 39.8% | 5,000 1.0% | 2,475 0.5% | |
| DE ELECTORS | Marla Blunt-Carter, John Daniello, Marie Mayor | |||||
| DISTRICT OF COLUMBIA | 3 | 317,323 92.1% | 18,586 5.4% | 2,036 0.6% | 6,411 1.9% | |
| DC ELECTORS | Meedie L. Bardonille, Barbara A. Helmick, Jacqueline Thompson-Echavarria | |||||
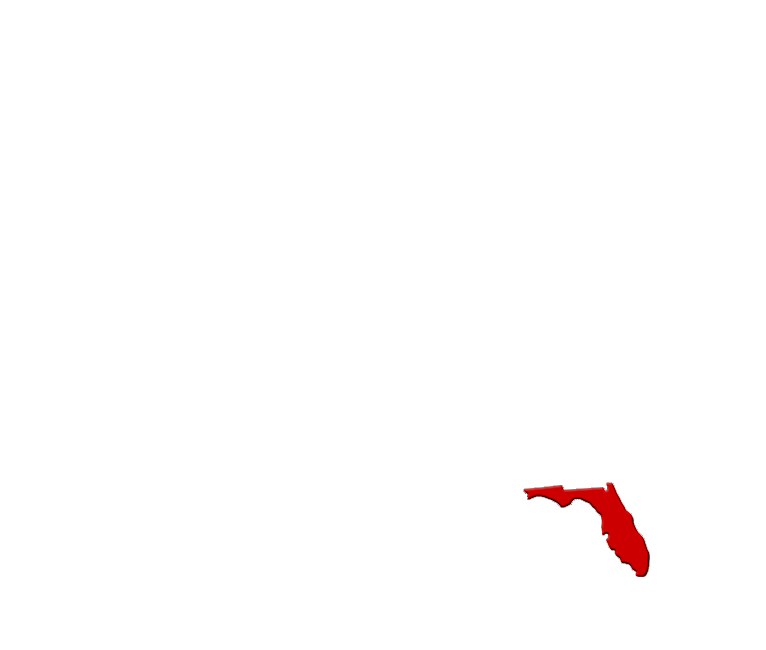
| FLORIDA | 29 | 5,297,045 47.9% | 5,668,731 51.2% | 70,324 0.6% | 31,356 0.3% | |
| FL ELECTORS | Maximo Alvarez, Jeff Brandes, John Browning, Marili Cancio, Nelson Diaz, Peter Feaman, Randy Fine, Jason Fischer, Charlotte Flynt, Joe Gruters, Roy Hinman, James Holton, Marva Johnson, Belinda Keiser, Kathleen King, JC Martin, Patrick Neal, Jeanette Nuñez, Kathleen Passidomo, Daniel Perez, Keith Perry, Moshe Popack, Ray Wesley Rodrigues, Diane Scherff, Frank Schwerin, Chris Sprowls, Linda Stoch, Tim Weisheyer, Christian Ziegler | |||||
| GEORGIA | 16 | 2,473,633 49.5% | 2,461,854 49.2% | 62,229 1.2% | 2,244 0.0% | |
| GA ELECTORS | Stacey Yvonne Abrams, Gloria S. Butler, Wendy Davis, Bobby L. Fuse& Jr., Deborah Gonzalez, Steve Henson, Van R. Johnson, Pedro "Pete" Marin, Fenika Thomas Miller, Ben E. Myers& Jr., Rachel Paule, Calvin Smyre, Bob Trammell& Jr., Sachin Varghese, Nikema Williams, Cathy Woolard | |||||
| HAWAII | 4 | 366,130 63.7% | 196,864 34.3% | 5,539 1.0% | 5,936 1.0% | |
| HI ELECTORS | Hermina (Mina) Morita, John William Bickel, Kainoa Kaumeheiwa-Rego, Michael Golojuch Sr. | |||||
| IDAHO | 4 | 287,021 33.1% | 554,119 63.8% | 16,404 1.9% | 10,390 1.2% | |
| ID ELECTORS | Rod Beck, Raúl Labrador, Janice McGeachin, Melinda Smyser | |||||
| ILLINOIS | 20 | 3,471,915 57.5% | 2,446,891 40.6% | 66,544 1.1% | 48,394 0.8% | |
| IL ELECTORS | Omar Aquino, Julia Kennedy Beckman, Christine Benson, Michael Cabonargi, Michael Cudzik, Vera Davis, Lauren Beth Gash, Don Harmon, Michelle Harris, Don Johnston, Lori Lightfoot, Jayne Mazzotti, Brandon Phelps, Al Riley, Cynthia Santos, Nancy Shepherdson, Sheila Stocks-Smith, Silvana Tabares, Emanuel Welch, Kristina Zahorik | |||||
| INDIANA | 11 | 1,242,498 41.0% | 1,729,857 57.0% | 58,901 1.9% | 1,954 0.1% | |
| IN ELECTORS | George E. Brown, Beth Boyce, James R. Buck, Dana Dumezich, Jeffery M. Heinzmann, Kyle J. Hupfer, Debra K. Johnson, Brian L. Mowery, Douglas B. Oler, William Springer, Matthew D. Whetstone | |||||
| IOWA | 6 | 759,061 44.9% | 897,672 53.1% | 19,637 1.2% | 14,501 0.9% | |
| IA ELECTORS | Kurt Brown, David Chung, Ronald Forsell, Polly Granzow, Charlie Johnson, Thad Nearmyer | |||||
| KANSAS | 6 | 570,323 41.5% | 771,406 56.1% | 30,574 2.2% | 1,683 0.1% | |
| KS ELECTORS | Treatha Brown-Foster, Mark Kahrs, Shannon Golden, Michael Kuckelman, Helen Van Etten, Emily Wellman | |||||
| KENTUCKY | 8 | 772,474 36.2% | 1,326,646 62.1% | 26,234 1.2% | 11,414 0.5% | |
| KY ELECTORS | Earl Bush, Richard J. Grana, Bob M. Hutchison, Ken Keams& II, Laura LaRue, Carol Rogers, Jack L. Richardson& IV, Ellen C. Williams | |||||
| LOUISIANA | 8 | 856,034 39.9% | 1,255,776 58.5% | 21,645 1.0% | 14,607 0.7% | |
| LA ELECTORS | Beth A. Billings, Rodney Michael Collier, Louis "Woody" Jenkins, Kay Kellogg Katz, Ross Little& Jr., Robert C. Monti, Vinson J. Serio, Eric F. Skrmetta, | |||||
| MAINE FIRST DISTRICT | 1 | 266,376 60.1% | 164,045 37.0% | 7,343 1.7% | 5,348 1.2% | |
| ME1 ELECTOR | Jay Philbrick | |||||
| MAINE SECOND DISTRICT | 1 | 168,696 44.8% | 196,692 52.3% | 6,809 1.8% | 4,152 1.1% | |
| ME2 ELECTOR | Peter LaVerdiere | |||||
| MAINE AT-LARGE | 2 | 435,072 53.1% | 360,737 44.0% | 14,152 1.7% | 9,500 1.2% | |
| ME ELECTORS | Shenna Bellows, David Bright | |||||
| MARYLAND | 10 | 1,985,023 65.4% | 976,414 32.2% | 33,488 1.1% | 42,105 1.4% | |
| MD ELECTORS | Corynne B. Courpas, Thelma T. Daley, Sachidanand Hebbar, Patrick J. Hunt, Gloria Lawlah, Catalina Rodriguez Lima, Kathleen Matthews, Peter E. Perini, Kent Roberson, Sheree Sample-Hughes | |||||
| MASSACHUSETTS | 11 | 2,382,202 65.6% | 1,167,202 32.1% | 47,013 1.3% | 34,985 1.0% | |
| MA ELECTORS | Kathleen Donaghue, Joseph F. Kelly, Nicole M. LaChapelle, Thomas J. Larkin, Robert T. Markel, Linda Monteiro, Jay Manuel Rivera, Norma Shulman, Leslie R. Phillips, Teresa Walsh, Wayne D. Yeh | |||||
| MICHIGAN | 16 | 2,804,040 50.6% | 2,649,852 47.8% | 60,381 1.1% | 25,029 0.5% | |
| MI ELECTORS | Marseille Allen, Sharon Baseman, Chuck Browning, Chris Cracchiolo, Carolyn Holley, Michael W. Kerwin, Bonnie J. Lauria, Blake Mazurek, Mark Edward Miller, Helen Moore, Susan Nichols, Steven Rzeppa, Robin Smith, Timothy E. Smith, Bobbie C. Walton, Conner Wood | |||||
| MINNESOTA | 10 | 1,717,077 52.4% | 1,484,065 45.3% | 34,976 1.1% | 41,053 1.3% | |
| MN ELECTORS | Melvin Aanerud, Muhammad Abdurrahman, Joel Heller, Nausheena Hussain, Nancy Larson, Mark Liebow, Roxanne Mindeman, Cheryl Poling, Diana Tastad-Damer, Travis Thompson | |||||
| MISSISSIPPI | 6 | 539,398 41.1% | 756,764 57.6% | 8,026 0.6% | 9,571 0.7% | |
| MS ELECTORS | Frank W. Bordeaux, John Dane III, Francis C. Lee, E. Bruce Martin, Johnny McRight, Terry Reeves | |||||
| MISSOURI | 10 | 1,253,014 41.4% | 1,718,736 56.8% | 41,205 1.4% | 13,007 0.4% | |
| MO ELECTORS | Susan E. Eckelkamp, Dan Wesley Hall, Daniel Jay Hegeman, Penny L Henke, Michael W. Homeyer, William G. (Bill) Kartsonis, Glen Robert Kolkmeyer, Sherry Kuttenkuler (Arthaud), Maureen O'Gorman, Ronald F. Richard | |||||
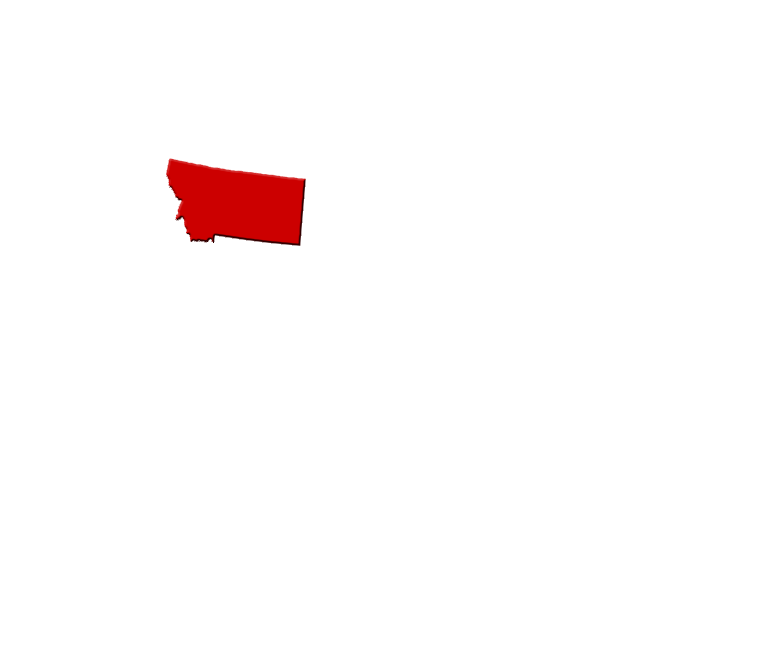
| MONTANA | 3 | 244,786 40.5% | 343,602 56.9% | 15,252 2.5% | 34 0.0% | |
| MT ELECTORS | Thelma Baker, Becky Stockton, Brad Tschida | |||||
| NEBRASKA FIRST DISTRICT | 1 | 132,261 41.1% | 180,290 56.0% | 7,495 2.3% | 1,840 0.6% | |
| NE1 ELECTOR | George Olmer | |||||
| NEBRASKA SECOND DISTRICT | 1 | 176,468 52.0% | 154,377 45.4% | 6,909 2.0% | 1,912 0.6% | |
| NE2 ELECTOR | Precious McKesson | |||||
| NEBRASKA THIRD DISTRICT | 1 | 65,854 22.3% | 222,179 75.4% | 5,879 2.0% | 919 0.3% | |
| NE3 ELECTOR | Teresa Ibach | |||||
| NEBRASKA AT-LARGE | 2 | 374,583 39.2% | 556,846 58.2% | 20,283 2.1% | 4,671 0.5% | |
| NE ELECTORS | Steve D. Nelson, Darlene Starman | |||||
| NEVADA | 6 | 703,486 50.1% | 669,890 47.7% | 14,783 1.1% | 17,217 1.2% | |
| NV ELECTORS | Artemisa Blanco, Yvanna Cancela, Gabrielle D' Ayr, Sarah Mahler, Joseph Throneberry, Judith Whitmer | |||||
| NEW HAMPSHIRE | 4 | 424,937 52.7% | 365,660 45.4% | 13,236 1.6% | 2,372 0.3% | |
| NH ELECTORS | Mary Carey Foley, Dana Hilliard, Steve Shurtleff, Donna M. Soucy | |||||
| NEW JERSEY | 14 | 2,608,400 57.3% | 1,883,313 41.4% | 31,677 0.7% | 26,067 0.6% | |
| NJ ELECTORS | Saily Avelenda, Richard H. Berdnik, Michael Beson, Michele DiIorgi, Kelvin S. Ganges, Francesca Giarratana, Brendan Gill, LeRoy Jones, Roberta Karpinecz, Edward Kologi, Jill Kotner, Tammy S. Murphy, Matthew Platkin, Derya Taskin | |||||
| NEW MEXICO | 5 | 501,614 54.3% | 401,894 43.5% | 12,585 1.4% | 7,872 0.9% | |
| NM ELECTORS | Vincent Alvarado, Brianna Gallegos, Ben Salazar, Aleta Suazo, Stephanie Thomas | |||||
| NEW YORK | 29 | 5,244,886 60.9% | 3,251,997 37.7% | 60,383 0.7% | 59,595 0.7% | |
| NY ELECTORS | Stuart H. Appelbaum, Gale A. Brewer, Byron W. Brown, Mario F. Cilento, Hillary Rodham Clinton, William J. Clinton, Andrew M. Cuomo, Alphonso David, Ruben Diaz& Jr., Thomas P. DiNapoli, Hazel Dukes, Thomas J. Garry, George K. Gresham, Carl E. Heastie, Kathy C. Hochul, Judith Hunter, Jay S. Jacobs, Corey Johnson, Letitia A. James, Gary S. LaBarbera, June O'Neill, Crystal Peoples-Stokes, Katherine M. Sheehan, Andrea Stewart-Cousins, Scott Stringer , Anastasia M. Somoza, Mary Sullivan, Xiao Wang, Rhonda Weingarten | |||||
| NORTH CAROLINA | 15 | 2,684,292 48.6% | 2,758,775 49.9% | 48,678 0.9% | 33,059 0.6% | |
| NC ELECTORS | Daniel Bradford Barry, Angie Cutlip, Mark Delk, Jonathan L. Fletcher, Tina Forsberg, Edwin L. Gavin II, Thomas William Hill, Chauncey Lambeth, Susan Mills, Michele A. Nix, Danny W. Overcash, Melisa Bell Taylor, Michael D. Whatley, Dave Wickersham, Blake E. Williams | |||||
| NORTH DAKOTA | 3 | 115,042 31.8% | 235,751 65.1% | 9,371 2.6% | 1,860 0.5% | |
| ND ELECTORS | Sandy J Boehler, John Trandem, Robert Wefald | |||||
| OHIO | 18 | 2,679,165 45.2% | 3,154,834 53.3% | 67,569 1.1% | 20,634 0.3% | |
| OH ELECTORS | Patti Alderson, Karen Arshinkoff, J. Kenneth Blackwell, Jim Canepa, Keith Cheney, Barbara Clark, Madison Gesiotto, Dave Johnson, LeeAnn Johnson, Stephen S. Loomis, Joy Padgett, Robert A. Paduchik, Ryan M. Stenger, Rob Scott, Jane M. Timken, Mark Wagoner, Bonnie Ward, James Wert | |||||
| OKLAHOMA | 7 | 503,890 32.3% | 1,020,280 65.4% | 24,731 1.6% | 11,798 0.8% | |
| OK ELECTORS | Lonnie Lu Anderson, Steve Fair, A.J. Ferate, Linda Huggard, Chris Martin, Carolyn McLarty, Ronda Vuillemont-Smith | |||||
| OREGON | 7 | 1,340,383 56.5% | 958,448 40.4% | 41,582 1.8% | 33,908 1.4% | |
| OR ELECTORS | Laura Gillpatrick, Carla Lynn Hanson, Leigha LaFleur, Pete Lee, Sean Nikas, Nathan Joseph Soltz, Lawrence D. Taylor | |||||
| PENNSYLVANIA | 20 | 3,458,229 49.9% | 3,377,674 48.7% | 79,380 1.1% | 21,693 0.3% | |
| PA ELECTORS | Nina Ahmad, Val Arkoosh, Cindy Bass, Rick Bloomingdale, Ryan Boyer, Paige Gebhardt Cognetti, Daisy Cruz, Kathy Dahlkemper, Janet Diaz, Charles Hadley, Jordan Harris, Malcolm Kenyatta, Gerald Lawrence, Clifford Levine, Virginia McGregor, Nancy Mills, Marian Moskowitz, Josh Shapiro, Sharif Street, Connie Williams | |||||
| RHODE ISLAND | 4 | 307,486 59.4% | 199,922 38.6% | 5,053 1.0% | 5,296 1.0% | |
| RI ELECTORS | James A. Diossa, Sabina Matos, Joseph Robert Paolino Jr., Elizabeth Beretta Perik | |||||
| SOUTH CAROLINA | 9 | 1,091,541 43.4% | 1,385,103 55.1% | 27,916 1.1% | 8,769 0.3% | |
| SC ELECTORS | Teresa Altman, Sandra H. Bryan, Cindy Costa, Cheryl Cuthrell, Terry Hardesty, Suzette Jordan, Gerri McDaniel, Drew McKissick, James S. Ulmer Jr. | |||||
| SOUTH DAKOTA | 3 | 150,471 35.6% | 261,043 61.8% | 11,095 2.6% | 0 0.0% | |
| SD ELECTORS | Dan Lederman, Jason R. Ravnsborg, Larry Rhoden | |||||
| TENNESSEE | 11 | 1,143,711 37.5% | 1,852,475 60.7% | 29,877 1.0% | 27,788 0.9% | |
| TN ELECTORS | Julia Atchley-Pace, Tina J. Benkiser, Kathy Bryson, Paul Chapman, Cindy Hatcher, Beverly Knight-Hurley, Jim Looney, Mary Ann Parks, Terry Roland, Scott Smith, Dr. John S. Stanbery | |||||
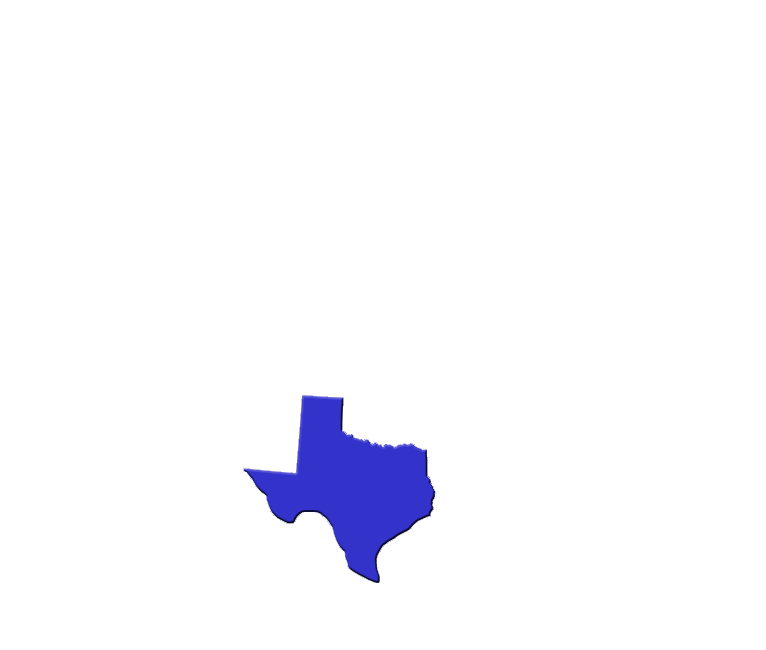
| TEXAS | 38 | 5,259,126 46.5% | 5,890,347 52.1% | 126,243 1.1% | 39,340 0.3% | |
| TX ELECTORS | coming soon... | |||||
| UTAH | 6 | 560,282 37.6% | 865,140 58.1% | 38,447 2.6% | 24,420 1.6% | |
| UT ELECTORS | coming soon... | |||||
| VERMONT | 3 | 242,820 66.1% | 112,704 30.7% | 3,608 1.0% | 8,296 2.3% | |
| VT ELECTORS | coming soon... | |||||
| VIRGINIA | 13 | 2,413,568 54.1% | 1,962,430 44.0% | 64,761 1.5% | 19,765 0.4% | |
| VA ELECTORS | coming soon... | |||||
| WASHINGTON | 12 | 2,369,612 58.0% | 1,584,651 38.8% | 80,500 2.0% | 52,868 1.3% | |
| WA ELECTORS | coming soon... | |||||
| WEST VIRGINIA | 5 | 235,984 29.7% | 545,382 68.6% | 10,687 1.3% | 2,678 0.3% | |
| WV ELECTORS | coming soon... | |||||
| WISCONSIN | 10 | 1,630,866 49.4% | 1,610,184 48.8% | 38,491 1.2% | 18,500 0.6% | |
| WI ELECTORS | coming soon... | |||||
| WYOMING | 3 | 73,491 26.6% | 193,559 69.9% | 5,768 2.1% | 3,947 1.4% | |
| WY ELECTORS | coming soon... | |||||
| TOTAL POPULAR VOTE | 538 | 81,283,501 51.3% |
74,223,975 46.8% |
1,865,535 1.2% | 1,056,620 0.7% |
|
As I mentioned in a previous post, I've decided not to spend nearly as much time covering the 2020 election as I had in previous years. But election night is special, and I think it's important to be here for those who might have questions.
Here are a few links of interest as we get started:
— My analysis of the race from last week
— The 2020 page of the site where you can make your own map
— My Twitter account, where you can send me questions
2:15 pm - I'll be checking in sporadically throughout the afternoon, and then will be here all evening. If you have any questions or comments at anytime you can Tweet them to me, or use the yellow button on the sidebar to the left to send them to me directly.
2:30 pm - As I do every election, we're starting the election with most of the states already colored in on the map. This gives us a more accurate view of where the race really stands as results start to come in. Obviously if there is a surprise I'll get it fixed quickly, but this is a fairly safe starting point!
2:40 pm - However, I believe this may be an election night unlike most in recent memory. Due to the large number of early ballots this year, networks are not necessarily going to call state winners as they have in the past. Some states count early ballots first while others count election day ballot first, so you could see one candidate take a big early lead before the other ballots are counted. Some are calling this potential a "red mirage" and a "blue mirage". Because of this, networks may not call a state as soon as they normally do. CNN and NBC News have more details.
2:50 pm - Speaking of those historic early voting turn out numbers, the New York Times has some cool infographics that compare it with
3:30 pm - Trump is predicting he'll surpass the 306 electoral votes he earned on election night in 2016. If he does, it won't be by much more. If our starting map above is right, Trump's ceiling is 335 votes. the previous election so you can get a sense of how big 2020 has been.
4:10 pm - Sorry for the radio silence there. Had to order dinner. Pizza incoming, but it's been so long since I've done it, I had to reset my password and figure out their new system!
4:30 pm - If you're surfing the web to find the latest poll analyses, be careful! Each has their own biases and/or problems that might effect how they read the numbers. For example, the Economist has Biden up huge in Pennsylvania, while RealClear Politics has things almost even. Which is closer to the truth? If you look at the polls the Economist has aggregated compared to those used by RCP, you can start to get a sense of the issue. The Economist is not including any poll that has Trump leading in their analysis. Is that bias? Or is perhaps RCP including unreliable polls and the Economist is just being responsible by weeding them out? Unfortunately it's hard for us regular Joe's to figure out.
5:00 pm - In another sign of the times, Trump and Biden will be spending election night at home.
5:05 pm - All right friends, I'm going to take a quick dinner break. When I return, I'll be here for the rest of the night — whether we have a winner or not!
5:50 pm - I'm back! While I get my TV screens ready here at PEHQ, check out this article from 2015 with Nelson Hernandez, creator of the video game that gave this site its name, and helped inspire my interest in the electoral college.
6:05 pm - The first polls of the election are officially closed! According to this list (which might be worth keeping handy tonight), the eastern time zones of Indiana and Kentucky closed at 6pm.
6:15 pm - There are electoral college tie possibilities on the board. Here's one plausible way it could happen.
6:30 pm - Obviously each candidate voted for themselves today, and that includes independent candidate Kanye West who, I would never have guessed, officially resides in Wyoming!
6:50 pm - We're about ten minutes away from polls closing in six states: Georgia, Indiana, South Carolina, Virginia, and Vermont. The eastern time zone portion of Florida will also close at 7pm.
6:55 pm - Remember to send in questions or comments using the yellow button in the sidebar, Twitter, or email!
7:00 pm - 7 o'clock! Election night begins in earnest now!
7:02 pm - Fox just announced VA and VT to Biden, CNN projected IN to Trump.
7:05 pm - My least favorite part of election night... listening to the pundits when they don't have much to go off yet so they have to vamp for time!
7:10 pm - Fox calls Kentucky for Trump. By the way, I may not announce every one of these projections if we already have them on our map above. But with nothing much to report yet, I'll play along!
7:25 pm - The New York Times is a great site for getting live data. Currently, they show Trump doing a bit better than expected in Florida.
7:30 pm - Two major states closing right now: North Carolina and Ohio, and West Virginia as well.
7:31 pm - No surprise, Fox calls WV for Trump.
7:40 pm - The networks are throwing so much data at us! I have four screens going and can barely keep up!
7:42 pm - The previously mentioned NYT link with results has a nice feature that tells you how long they expect each state to take to count the different types of votes.
7:45 pm - 16 states, DC, and parts of 5 other states closing at 8pm.
7:50 pm - The infamous NYT needles have Trump at a 95% chance of winning Florida.
7:51 pm - They also predict Trump has a 75% chance of taking Georgia, while Biden has a 65% chance of winning North Carolina.
7:56 pm - AP calls SC to Trump.
8:00 pm - Lots of projections coming in — all already on our map.
8:05 pm - ABC shows Biden doing well in Ohio, but exit polling shows positive Trump approval. So could be yet another tight race there.
8:10 pm - 538's Nate Silver says Trump moves from a 10% chance to win to 33% if he takes Florida.
8:13 pm - Like Ohio, Biden looking good in Georgia, but Trump at 50% approval rating. Another potentially close race.
8:22 pm - NYT gives Trump an 85% to win Georgia, while Biden falls to a 57% chance to take North Carolina.
8:30 pm - Trump up now to 56% in NC according to the NYT needle.
8:35 pm - Of course that needle moved over 10 point within 30 minutes, so keep that in mind when deciding how much stock to put in it.
8:45 pm - Listening to ABC you wouldn't know Biden seems to be doing so well according to the numbers they are showing.
8:55 pm - 14 states closing in 5 minutes, including AZ, MI, MN, TX, and WI.
8:57 pm - Fox giving Trump 85% chance of taking NC.
9:00 pm - Lots of states being called. Our map still has not changed tonight.
9:05 pm - CNN & ABC: Biden 73-48
9:06 pm - NBC: Biden 80-48
9:12 pm - ABC notes Trump campaign is worried about Ohio.
9:15 pm - Biden's lead has gone from 12% to 6% to 4% in Ohio. According to NYT, early voting there is reported early. According to ABC Trump's approval is fairly high there. So who knows what's going on! 538 notes that if Trump loses OH he almost certainly loses the election.
9:20 pm - Fox projects the Democrats will hold the House of Representatives.
9:33 pm - My personal view at this exact moment is that Trump is looking good. It appears he will take FL, TX, NC, and GA. And Biden's lead in OH is almost gone. HOWEVER, Biden still can win easily even after losing all those swing states due to the usually Democratic friendly states of MI, MN, WI, and PA.
9:35 pm - With over 70% of the vote in, The race is basically toed at 49% each in Texas.
9:50 pm - Iowa and Nevada are two swing states closing at the top of the hour.
10:50 pm - We're back up! Apparently the site went down. Too many visitors, or a conspiracy from the highest levels to silence me? We may never know!
If the site goes down again I'll keep chatting on Twitter.
11:00 pm - No officially called states that we don't already have called yet, except VA by Fox. However, FL and OH are almost certainly going to Trump. TX, GA, and NC will probably go to Trump. And VA is probably going to Biden. If that's the case, the electoral count would be 241 to 216 to Trump.
11:05 pm - Fox calls FL for Trump.
11:15 pm - Not sure why election boards in GA and PA are choosing to stop counting votes. What else do they have to do tonight?! When people potentially don’t trust your numbers later, this is the kind of thing they’ll use as evidence. So why arm them?
11:28 pm - Fox call AZ for Biden
11:35 pm - Assuming: FL, GA, NC, OH, TX to Trump, and AZ, MN, and VA to Biden, then the electoral vote total would be Trump 241-237
11:43 pm - With 50% of the vote in, Trump leads Michigan and Pennsylvania. 11:50 pm - NYT needle is ticking back towards Biden in GA and NC, but Trump still projecting at about 80% chance to win.
12:01 am - VIRGINIA to BIDEN
12:01 am - OHIO to TRUMP
12:01 am - FLORIDA to TRUMP
12:14 am - NYT has the Georgia needle back on the Biden side, despite not many votes seemingly having changed.
12:20 am - Couple of emails. First, yes I meant AM not PM after midnight. Bad cut and paste job! Second, someone asked me to double check my numbers below. I have Trump at 241 and Biden at 237 with those assumptions. After taking a second look I think those are right.
12:25 am - CNN says NE's tossup electoral vote appears to be leaning to Biden. Maine's tossup electoral vote appears to be leaning to Trump.
12:26 am - Fox projects MN to Biden.
12:30 am - Biden is apparently about to make a statement. Look for him to assume he's all but won while calling on people to be patient and wait until all the votes have been counted.
12:32 am - AP projects IA to Trump.
12:37 am - IOWA to TRUMP
12:37 am - MINNESOTA to BIDEN
12:41 am - TEXAS to TRUMP
12:46 am - Biden just gave a speech assuming he's all but won while calling on people to be patient and wait until all the votes have been counted...
12:50 am - President Elect has the electoral count at Biden leading 226 to 216 with 96 votes remaining.
12:55 am - Trump has announced he will speak soon as well. Look for him to claim they have all but won, and that the states delaying counts are doing so for nefarious reasons. He'll also likely speak way too long!
1:20 am - I was trying to do some quick back of the envelope math in Pennsylvania, but my math sucks!. About 4,571,000 votes in so far with an estimated 65% in. So about 1,600,000 votes remain. Trump leads by about 680,000.
1:27 am - CNN calls Nebraska: 4 votes to Trump, 1 to Biden
1:33 am - OK, if my math is right (and who knows if it is!) I think Biden would need to win about 70% of the outstanding ballots in Pennsylvania to take the lead.
1:45 am - Again, if my math is right Biden would need to win about 65% of the outstanding ballots in Georgia to take the lead.
1:47 am - Trump would need to win about 65% of the outstanding ballots in Arizona to take the lead.
1:50 am - Biden would need to win about 59% of the outstanding ballots in Wisconsin to take the lead.
1:58 am - Trump would need to win about 57% of the outstanding ballots in Nevada to take the lead.
2:00 am - Biden would need to win about 62% of the outstanding ballots in Michigan to take the lead.
2:01 am - Keep in mind all these numbers use the NYT estimate of ballots remaining. If that stat is off, so are these percentages.
2:17 am - So here's where we're at folks. Assuming the following (all of which I think are possible at this point)
-- Biden wins AZ, NV, and the tossup NE vote
-- Trump wins NC, GA, and PA
Then Trump would win the election with a win in MI or WI.
Assuming the above and the following:
-- Trump wins the tossup ME vote
-- Biden wins both MI and WI
We'd be tied! Biden would win 270-268
2:32 am - Trump has spoken. He claimed he has all but won, and that the states delaying counts are doing so for nefarious reasons. He also spoke way too long...
3:00 am - Well, I think that is going to do it for me tonight! I'll leave you with this. I went back and checked my math on how much of the remaining vote the currently trailing candidate needs to get to take over the lead.
Pennsylvania seems to be the safest lead with Biden needing about 75% of the remaining votes. Arizona is next with Trump needing about 70% of the outstanding votes. Georgia and Michigan follow with Biden needing about 65% of what's left. In North Carolina and Wisconsin, Biden would need in the low 60% range. And in Nevada, Trump would need a little less than 60%.
I don't know where exactly those remaining votes will come from in each state, so can't speculate on how likely a candidate is to get them. And this of course assumes the New York Times estimates on remaining votes are close to accurate. But from a pure numbers point of view, those are pretty significant leads for what is remaining. If those leads hold, Trump would be the President Elect with 294 electoral votes to 244 for Biden. Trump would have to lose at least two big states for Biden to win the election.
And if things weren't weird enough in 2020 — there is still a tie scenario in play. If Biden takes NC and WI, each candidate would have 269 votes!
Thanks for staying up with me this election night! I'll follow up with more info once we know something!
9:45 am - Let's catch up! When last we left:
In Michigan, Biden needed to win 62% of the 24% remaining ballots to overcome Trump's lead. In Wisconsin, Biden needed to win 62% of the 16% remaining ballots to overcome Trump's lead. And it appears he has done that. What's crazy is that he did it in Michigan with 10% of the vote still out, meaning he had to have had a much bigger than 62% lead in those 16% of ballots counted since last night. Must have been some hugely Democratic-leaning areas counting late.
Pennsylvania has barely added anything to its count since last night, so Trump still leads by 15% with 76% of the estimated ballots in. However, analysts are already saying it looks like Biden will win there too. That would take him winning 75% of the remaining vote.
Putting aside how large those final numbers seem to be going for Biden, let's look at the impact. Assume Biden can hold on in MI and WI, and that Trump does the same in PA, GA, and NC. Trump is also leading 52% to 45% in that toss-up Maine district with 87% of the vote in. The electoral vote: 270 to 268 Biden.
What does that mean? Recounts, lawsuits, faithless elector worries... and this election dragging on even longer since any single change could swing the results!
10:25 am - Please ignore takes like this one that claim not winning the popular vote is a sign of “minority rule”. The popular vote is absolutely meaningless in our current system and should not be looked at as a valid indicator of “the will of the people”. The popular vote takes 51 separate elections and tries to pretend like it’s just one, even though the voters in those 51 elections and even the candidates themselves don’t treat it that way. I have an article with more detailed reasoning here. 11:30 am - Two last things from me, then I'm going to go read a book and maybe take a walk later!
As longtime readers know, I try to keep my writing on this site non-partisan. There are plenty (PLENTY!) of places for you to get information from someone who wants to sell you on their political point of view. There seem to be vanishingly few places to go to get opinions not influenced by partisan politics. So as you read this, it's not coming from a political place, but from what I believe is an unbiased look at what has happened in recent elections.
First of all, we need to come up with a better way to run elections. It's 2020, and I had to mark my ballot like I was a kid in 1984 taking a standardized test filling in bubbles! We have places stopping their vote count overnight because someone has to stand there and manually feed ballots to a machine. Then because bigger cities take longer, what appear to be insurmountable leads suddenly vanish when counting resumes.
Again, read that carefully, because I am not implying any kind of fraud or shenanigans! However, these problems in the system do create very real confusion and uncertainty, which can then play into the minds of those who want to see conspiracy. (And if you think I'm just talking about Republicans in 2020, I'll get to you Democrats from 2016 in a moment!)
So, the first thing we need to do is find a better way to vote and then tabulate those votes. There is no reason late votes from one precinct should swing an election hours after the rest of the votes have been counted, because they should all be counted at basically the same time. Some people say, how can we trust voting without paper ballots? I'll tell you — look at banks! How much do you trust computerized banking with your hard earned money? If banks can handle billions of transactions per day, surely we can come up with something that can handle 150 million votes once every four years!
Secondly, and just as importantly, the media needs to take a hard look at themselves. No, seriously, harder. Any honest person has to admit, major media as a whole has a left lean to it. And to be clear, I mean the supposedly non-biased media. I'm ignoring outlets that are openly partisan. We're talking ABC, NBC, CBS, CNN, the New York Times, The Washington Post, USA Today, etc... All claim to be fair and balanced. We all know they're not, and they know they're not. I don't say this to castigate them for their overall bias. But because of the bias, they need to be especially careful about their blindspots. I'm giving them the benefit of the doubt that what they have done the past two elections was not intentional, but an honest overlooking of their own prejudices.
Two elections in a row, we were told it was almost mathematically impossible for Trump to win. Two elections in a row, we were told Republicans were a small and vanishing party. Two elections in a row, we were told angry white racists were all that was left of them. But Trump won once and is right on the razor's edge again, the Republican party brought out more voters than last time, and the Republican party grew their numbers in all racial categories except whites.
Once again, I don't say any of this to promote Trump or the Republicans. But they are actual facts. And the media has made a lot of people think they're not true. Just like some in the GOP are lapping up potential conspiracy theories due to voting concerns, Democrats are buying into everything the media tells them about the opposing party then assuming fraud when the media narrative is proven false, rather than believing the press was just wrong.
Something needs to change. Those in the media and polling companies need to accept this country is more conservative than they want to believe, and then take that fact into account when looking at elections. It may not be 50/50, but it's also not 60/40 either. Perhaps the biggest thing they can do to regain some credibility is to take their own advice and get more diverse. In polling, about 90% of journalists admit to being Democrats. As they might say, that doesn't reflect America.
Let me reiterate, I'm not raising up conservatism, denigrating Democrats, or vice versa. These are just basic fixes that might prevent some of the issues that have arisen. If Biden wins, the right is going to complain about voting "irregularities". And because of polling failures, some on the left still don't believe Trump won in 2016, and will probably be upset the Biden "landslide" was stolen from them in 2020.
Instead of just calling these people names and mocking them, why not fix the problems? And as a side benefit, maybe a lot of the rancor and divisiveness will go away when we're not assuming the other side is cheating, but legitimately going out and performing their civic duty just like we are ourselves.
Assuming every state lead stays the way it is right now, Joe Biden would win the presidency with exactly the 270 electoral votes needed. That would stand as the second lowest tally by a winning president in an election not thrown to the House in history (and the lowest if you count the 1876 election as being decided by Congress). If Biden takes Pennsylvania, he'd only be up to the sixth lowest winning tally.
If Nebraska didn't allow for split electoral votes, we might be looking at a tie scenario this year! And it's still not out of the question if faithless electors try to muck things up.
Back during those blissful pre-COVID days at the beginning of 2020, I prepared an electoral analysis for the site that I never ended up posting. I had Trump easily winning reelection, an outcome I knew would be controversial. But after this election, I'm more certain than ever it was right. Trump had survived everything thrown at him and nothing was sticking. The economy was rolling along strong. And the Democrats were split on the kind of candidate they wanted, meaning one side was going to be less enthused than the other when it came time to rally together. But it took a once-in-a-hundred-years pandemic to get the Democrats a win... with possibly the absolute bare number of votes needed. Without the pandemic, I believe Trump likely would have been able to scrounge up just the few more votes he needed to win.
Despite how it appeared on election night, there was a bit of a red wave apparently. Biden was heavily favored for president, Democrats were supposed to increase their lead in the House, and they were expected to take over the Senate. Instead, if Biden wins it will possibly be by less than Trump won by in 2016, Republicans actually gained ground in the House, and they will hold onto the Senate. A few days ago we were contemplating packing the Supreme Court, getting rid of Trump's tax cuts, and a lot more on the left's wish list. All that is all but gone for now. Even around the country, Republicans gained grounds in governor's mansions and state legislatures. Even in California, two major ballot initiatives touted by liberals went down in flames. Democrats may have won the battle, but the outcome of the war is still uncertain.
The takeaway is both sides have a lot to celebrate — and a lot to work on over the next election cycle.
As always, thanks for being part of this with me. I really appreciate you guys!
One final thought. There are 1,461 days until President Elect 2024. And doesn't Trump just seem like the kind of guy who might be willing to make another run after losing? Don't laugh! In four years he'll be the same age as Biden is this month!
feel free to send them to email@presidentelect.us.
original content and graphics
© 1999-2025 James R Whitson
